|
Back to Index
Food
Security Update March 2005
Relief Web
May
03, 2005
http://www.reliefweb.int/rw/RWB.NSF/db900SID/EGUA-6C2RH2?OpenDocument&rc=1&cc=zwe
Summary and
Implications
Consensus
is building around the view that food production in the 2004/05
agricultural season will be poor and not sufficient to satisfy the
consumption needs for the April 2005 - March 2006 consumption year.
Following a temporary improvement in availability as the new crop
is harvested, food access will once again become very difficult
for poor families. While plans to import food to fill the gap are
being made, it is urgent that objective assessments of the magnitude
and the geographic spread of the problem be undertaken in order
to help the Government of Zimbabwe determine whether they will need
outside assistance to close the food gap and how much assistance
may be required.
Seasonal
Timeline

Summary of
food security hazards in the 2004/05 consumption year
- Cereals were
not readily available in production deficit areas.
- Staple foods
were not easily affordable to poor households.
Food Security
Summary
The
April 2004 to March 2005 consumption year is over. The major food
security problem at the national level remains the inability of
a significant proportion of poor households to generate enough income
to buy adequate food to satisfy their dietary needs. Staple foods
and their primary substitutes continue to be available at most urban
and rural markets in varying quantities throughout the marketing
year. However, employment opportunities remain bleak. The formal
sector last year lost more jobs than it created. At sub-national
level staple cereals were not readily available to rural households
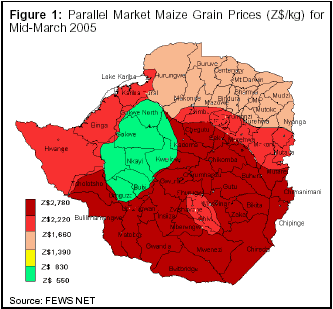
in the traditionally grain deficit areas of the country, as illustrated
by Figure 1. The map in Figure 1 illustrates the wide range of prices
at which maize grain is being sold on the parallel/informal markets
in different parts of the country. It also reflects the relative
availability of maize grain and maize meal in these areas. In 2004/05,
the highest maize grain prices (and most limited supplies) were
found in the red colored areas, followed by the pink colored areas
of the country.

The northern
fringes of the pink areas (Hwange, Binga and Kariba districts) and
the majority of the red colored districts are traditionally cereal
production deficit areas. The poor 2004/05 season in large portions
of the country drastically reduced casual labor opportunities, and
inadequate quantities of the relatively cheaper maize from the Grain
Marketing Board (GMB) was erratically supplied during the whole
marketing year to deficit areas. Reliance on an inefficient grain
distribution system, centered on the GMB, which has a statutory
monopoly over staple grain trade in Zimbabwe, exacerbated the situation.
Poor households survived by borrowing, reducing the number and size
of meals and skipping meals on some days. The on-going food assistance
to children, the chronically ill, the aged and disabled helped the
situation to some extent.
Prices of maize
grain and maize meal have been lower in the green colored areas.
These areas supplied most of the maize on the parallel markets into
the red and pink colored areas throughout much of the current consumption
year. Maize production in the green areas was relative good in the
last agricultural season, and the majority of farming households
in these areas had some surplus to sell.
Although the
annual rate of inflation maintained a downward trend during the
consumption year, from 505 percent in April 2004 down to 123.7 percent
in March 2005, it remained very high. Consequently, household incomes
continue to trail behind the general increases in prices in the
economy. The HIV and AIDS pandemic worsened the food security situation
of a significant number of Zimbabwean households. The burden of
caring for the sick took increasingly more of the household's income
as hospital costs shot up in step with inflation and the continued
decline of the Zimbabwe dollar's value against major currencies.
Potentially productive labor was also locked away from contributing
to household income generation activities, and significant numbers
were added to the growing list of child-headed households. The situation
of needy children could have been much worse were it not for some
food assistance that was offered under the child supplementary feeding
programs in schools, clinics and the communities. Food assistance
to some chronically ill and aged people in both urban and rural
areas helped ameliorate some food insecurity in the period under
review, but many sacrificed meals, health care and their children's
education to access food.
The minimum
wage policy failing as a social protection measure
Minimum
wages for both agricultural and manufacturing sectors (proxy for
the lowest paid workers in rural and urban area, respectively) have
been trailing behind the minimum household expenditure requirements
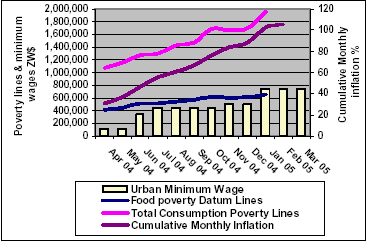
throughout the current consumption year. Figure 2 shows that the
manufacturing minimum wage rate for the month of January 2005 was
just enough to cover the minimum food needs of an urban household
of five people (Food Poverty datum line) but could only cover about
38 percent of the required minimum household expenditure (Poverty
Datum line) for the same month. The situation was worse for agricultural
workers. The increase in the minimum wage rate for the agricultural
sector was only 9 percent and 27 percent of the January 2005 national
Poverty Datum Line and Food Poverty Datum Line, respectively. Therefore,
the minimum wage rates need to be reviewed and brought into line
with increases in the cost of living for both rural and urban households,
in order to address the food insecurity and poverty problems facing
many of these households.
Figure 2:
National Poverty Lines Compared to Selected Minimum Wages in Urban
and Rural Areas

Source: CSO,
CCZ and ZCTU
Poor 2004/05
agricultural season prospects
Following
some useful early rains in mid October 2004 in the central and northeastern
districts of the country, the country received very little patchy
rainfall for about a month. Very few farmers planted with the October
rains. The dry spell was broken in the last ten days of November
2004 in most parts of the country. However, Midlands, Manicaland
and Matebeleland provinces received only light rains in this period.
The first ten days of December were very wet throughout the country,
and most farmers planted with these late rains. Maize seed availability
had improved by that time and therefore was not a major limiting
factor. From mid-December to the end of the month, meaningful rainfall
continued in the northern half of the country covering Midlands,
the three Mashonaland provinces and the northern part of Manicaland.
The southern provinces experienced little to no rainfall during
this period. Consequently, crops planted with the December rains
were suffering moisture stress by the end of December 2004.

The first ten
days of January were dry in whole of the country, save for patchy
light rains that fell in Hwange, the central parts of Mashonaland
West, northwestern parts of Mashonaland Central and the northern
tip of Mashonaland East. By this time, the southern half of this
country had gone for about thirty days without meaningful rainfall,
and crops planted with the patchy rainfall and early December rains
were suffering severe moisture stress. A large portion of the crops
reached permanent wilting point, and subsequent improvements in
the rainfall situation were not going to help much. The crop in
the northern half of the country was, however, still enjoying good
moisture conditions but requiring top dress fertilizer, which was
in critical short supply at the time. The rainfall situation improved
throughout the whole country from mid January 2005 but remained
poor in the southern parts of Matebeleland south and Masvingo provinces,
and the bulk of the December planted crop in these areas succumbed
to the persistent dry spell.
Dry conditions
returned to most parts of the country in February and persisted
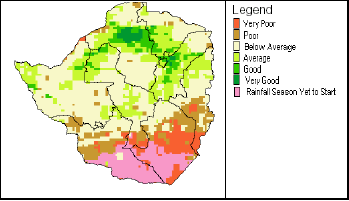
for a greater part of the month (Figure 4). Only the northern parts
of Matebeleland north and Midlands provinces had some meaningful
rainfall from the beginning to the 20th of February 2005. The last
ten days of February were generally wet in the three Mashonaland
provinces, the northern parts of Manicaland and the central parts
of Midlands; rainfall was light and patchy elsewhere. The continued
dryness since the early part of the year continued through March
(Figure 5). The February and March dry conditions dealt a devastating
blow on the most promising crop in much of the northern districts
of the country. The dry conditions coincided with the critical growth
stages of maize and cotton (flowering, pollination and grain filling
stages). Consequently, yields have been seriously lowered. The Water
Requirements Satisfaction Index (WRSI) forecasts zero maize yields
in most of the southern districts and below average maize yields
for most of the northern and central districts of Zimbabwe (Figure
6).
Figure 6: Water Requirement Satisfaction Index (WRSI) Model Maize
Crop Performance Forecast, end of March 2005

There
is consensus around the view that food production in the 2004/05
agricultural season will be poor and not nearly enough to satisfy
the needs of the country in the next consumption year. However,
objective and transparent assessments need to be undertaken in order
to determine the magnitude and the geographic spread of the production
shortfall. The assessments need to establish the 2004/05 food crop
production prospects, current levels of national food stocks, the
government's food import capacity, and ultimately the national 2005/06
consumption year food deficit. Such assessments will help the Government
of Zimbabwe to determine whether they will need outside assistance
to close the food gap and how much assistance may be required.
Lower dam
levels and limited irrigation in 2005
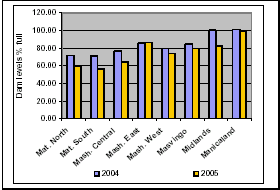
Figure 7:
Provincial Dam Levels for March 2004 and 2005

Due to the poor
rains in the 2004/05 season, dam levels in March 2005 are lower
than they were at the same time last year in all provinces except
for Mashonaland East, where dam levels were a percentage point higher
this year compared to last (Figure 6). When taken together, the
national dam levels this year were about 8 percentage points lower
in mid-March 2005 than they were same time last year. Dam levels
in Midlands Province were 18 percentage points below their March
2004 levels. In addition to recording the lowest percentage in flows,
the two Matebeleland provinces experienced between 12 and 14 percentage
drops in water level captured by their dams this year compared to
last year. This is raising concerns that water available for winter
irrigated cropping and for use by urban settlements may be very
limited this year.
Please credit www.kubatana.net if you make use of material from this website.
This work is licensed under a Creative Commons License unless stated otherwise.
TOP
|

