|
Back to Index
Community
Assessment of the Food Situation in Zimbabwe June/July 2002: FULL
REPORT
National
NGO Food Security Network (FOSENET)
October
12, 2002
Back
to Contents, Previous
Page, Next
Page
Food
availability
Almost all districts
were reported to produce maize in normal years, and a further 19
districts were reported to produce other grains. This information
will be followed up in future monitoring of seed access.
Household
food stocks were reported to be extremely low, although variable
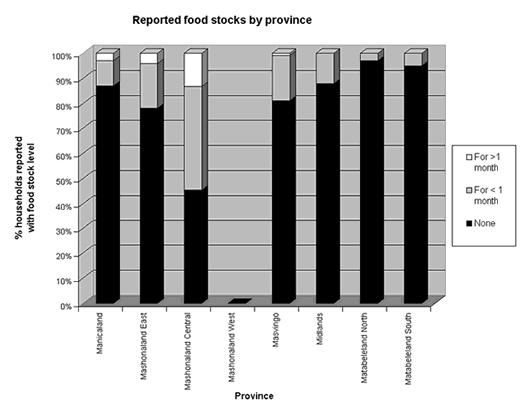
across provinces. The table and bar chart below indicates the reports
from monitors of the share of households with no food stocks, and
food stocks estimated to last for less than and more than one month.
All areas are food insecure with
stocks of less than one month. The reports suggest three levels
of severity however: Mashonaland Central and East with the greater
level household food stocks; Masvingo, Midlands and Manicaland with
less food stocks and Matabeleland North and South in the most
severe situation.
Table: Reported Household food stocks
by province
|
Reported household
food stocks
|
% households with No food
stocks
|
% with food for < 1 month
|
% with food for >1 month
|
|
Manicaland
|
87
|
10
|
3
|
|
Mashonaland East
|
78
|
18
|
4
|
|
Mashonaland Central
|
45
|
41
|
13
|
|
Mashonaland West
|
n.a
|
n.a
|
n.a
|
|
Masvingo
|
81
|
18
|
1
|
|
Midlands
|
88
|
12
|
0
|
|
Matabeleland North
|
97
|
3
|
0
|
|
Matabeleland South
|
95
|
5
|
0
|
(Mash West did not have sufficient
districts for this)

|
% of districts
reporting food present during august/ September
|
Maize
|
Oil
|
Bread
|
Sugar
|
|
Manicaland
|
33
|
83
|
83
|
67
|
|
Mashonaland East
|
44
|
89
|
67
|
100
|
|
Mashonaland Central
|
20
|
60
|
60
|
60
|
|
Mashonaland West
|
n.a
|
n.a
|
n.a
|
n.a
|
|
Masvingo
|
0
|
14
|
43
|
29
|
|
Midlands
|
43
|
29
|
43
|
86
|
|
Matabeleland North
|
40
|
0
|
0
|
20
|
|
Matabeleland South
|
0
|
33
|
0
|
0
|
(Mash West did
not have sufficient districts for this)
These findings
compare with those produced by the USAID Famine Early Warning System
Network (22 Jun 2002) giving some confidence in the reports.
As shown from
the table above, this pattern held generally for availability of
a number of food types with some variability. Generally food availability
was reported to be best in Mashonaland East and worst in Matabeleland
North and south. In respect of maize Masvingo, Matabeleland South
and Mashonaland Central reported lowest availability.
GMB Deliveries
One
of the most important sources of food is maize coming from GMB.
‘The GMB
is failing to supply’ ‘The GMB is not delivering food anymore’ were
common reports. When made they imply significant food insecurity
in a district.
GMB deliveries
are reported to be made to communities or obtained through the depots.
GMB deliveries were reported to be infrequent and inadequate,
with an average of 0,8 deliveries in the wards monitored per district
in the month. (The July FOSENET report found an average of 1,5 deliveries
in the wards covered by constituency in the past month). There was
variability in the frequency of deliveries, with a range of 0-5
GMB deliveries within the month in the same site. The reported
reduction in GMB deliveries in August – September compared to July
2002 needs to be further investigated.
It would be
useful to have a more objective periodic report by the GMB of its
pattern of deliveries across the country to parliament and the public.
The following
districts were reported to have wards that had not received any
grain deliveries in the period reviewed.
|
PROVINCE
|
Districts
identified as having wards that had not received any GMB deliveries
in the past month
|
|
Mashonaland
East
|
Marondera
rural
|
|
Mashonaland
Central
|
Mount
Darwin
|
|
Manicaland
|
Mutasa
|
|
Masvingo
|
Masvingo
urban
|
|
Midlands
|
Gokwe,
Chirumanzu
|
|
Matabeleland
North
|
Tsholotsho,
Lupane, Binga, Umguza
|
|
Matabeleland
South
|
Bulilimamangwe,
Matobo, Gwanda
|
The amounts
delivered also varied, with Mashonaland East having the greatest
average tonnage reported delivered and Matabeleland South the least.
Notably the price range in Mat South was also high, with the greatest
price reported of Z$190/10kg.
While the
bottom level price of GMB sales was constant at the control price
of Z$110/10kg, the upper ranges on varied up to Z$190/10kg or 73%
above the control price.
Table: Reported
frequency, amounts and costs of GMB maize
|
Amount
and cost of food delivered
|
Reported
average frequency of deliveries per sentinel ward
|
Estimated
Average tonnes of GMB maize delivered per sentinel ward during
the past month
|
Price
range in Z$ / 10kg
|
|
Manicaland
|
0.8
|
13
|
110-135
|
|
Mashonaland
East
|
1.0
|
18
|
110-136
|
|
Mashonaland
Central
|
1.0
|
7
|
110-110
|
|
Mashonaland
West
|
n.a
|
n.a
|
n.a
|
|
Masvingo
|
1.1
|
15
|
110-160
|
|
Midlands
|
0.8
|
8
|
110-119
|
|
Matabeleland
North
|
0.5
|
12
|
110-160
|
|
Matabeleland
South
|
0.5
|
4
|
110-190
|
(Mash West did
not have sufficient districts for this)
The average
tonnes per sentinel area was calculated as an average of the reported
amounts delivered by province.
Market supplies
As
noted earlier formal and informal market supplies are patchy with
less than 50% of districts covered reporting maize availability
and supply of bread and oil also at low levels. Sugar availability
appears to have improved somewhat since the last round of monitoring,
but not in Masvingo or Matabeleland. The cost of both formal and
informal market foods has already been noted in the previous FOSENET
monitoring report to be prohibitive. The table below indicates prices
reported for each source per 10kg/ Maize.
Table: Reported frequency,
amounts and costs of GMB maize
|
Price
ranges of maize suppliers
|
Formal
markets
Z$/10kg
|
Informal
markets
Z$/10kg
|
GMB
Z$
/ 10kg
|
|
Manicaland
|
Not
sold
|
650-900
|
110-135
|
|
Mashonaland
East
|
136
|
350-900
|
110-136
|
|
Mashonaland
Central
|
Not
sold
|
270-500
|
110-110
|
|
Mashonaland
West
|
Not
sold
|
700
|
n.a
|
|
Masvingo
|
800-850
|
500-1000
|
110-160
|
|
Midlands
|
110
|
500-880
|
110-119
|
|
Matabeleland
North
|
111
|
240-750
|
110-160
|
|
Matabeleland
South
|
300
|
500-1200
|
110-190
|
(Mash West did
not have sufficient districts for this)
The average
tonnes per sentinel area was calculated as an average of the reported
amounts delivered by province.
The range of
market prices are wide. The worst inflation on prices
(over ten times the control price) is found in the area of greatest
scarcity of both household stocks and GMB deliveries: Matabeleland
South. There is less price distortion in areas where food stocks
are higher and GMB food more available (Mashonaland East and Central).
Control of
speculation on food prices is not succeeding. It would seem
from these reports that informal speculation thrives in an environment
where is the lack of choice due to lack of household stores, weak
deliveries of controlled price food and no formal market sales.
The similarities in upper limits between neighbouring provinces
signals that people are moving across provinces to buy food.
Costs of up
to $1200 per 10 kg of maize are beyond the means of poor households.
What assets sales or sacrifices are people making to deal with such
prices?
‘Two families
nowadays share a 50kg bag and can only buy again after 2 months’
(Mutare rural)
Relief Deliveries
The
areas reporting relief activities were:
|
PROVINCE
|
Areas
identified as having relief food (and agencies named)
|
|
Mashonaland
West
|
None
|
|
Mashonaland
East
|
Chikomba
(through hospital); Mudzi (World Vision)
|
|
Mashonaland
Central
|
None
|
|
Manicaland
|
Mutare
Urban (churches); Chipinge (FOST, Plan Int and Christian care),
Mutasa (Plan Int)
|
|
Masvingo
|
Zaka (Care);
Chivi (Care); Mwenezi (World Vision) Chiredzi (FACT) Masvingo
urban (Care, Rudo, Red cross, FACT, AIDS levy fund, CADEC)
|
|
Midlands
|
Kwekwe
(Plan Int, FCTZ)
|
|
Matabeleland
North
|
Tsholotsho
(Plan Int); Lupane (CADEC); Umguza (CADEC); Bubi (World Vision);
Binga (Churches)
|
|
Matabeleland
South
|
Bulilimamangwe
(Care; World Vision; CADEC) Gwanda (World Vision)
|
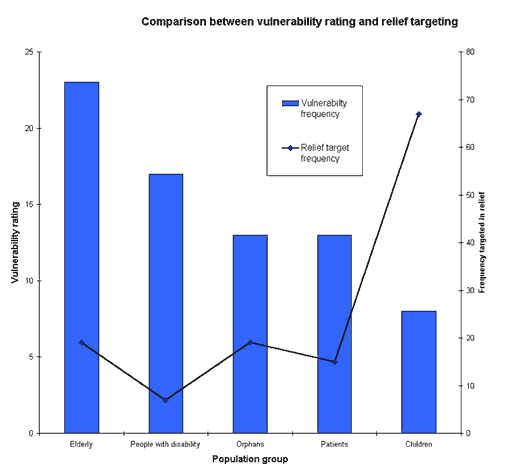
These programmes
are generally reported to target children under 5 years (in 67%
of cited programmes), schoolchildren grade 1-7 (67%); pregnant women
(7%), the elderly (19%), orphans (19%), patients (15%) disabled
people (7%) and households (25%).
There is some
degree of poor match between the targets of relief and the groups
identified as vulnerable (See figure below). People with disabilities
and the elderly seem to be relatively less well covered by relief.
Cash for work
was reported to be operating in all districts monitored except Mwenezi.
In only 12 districts did it operate as food, with cash, for
work. The amounts earned ranged from Z$100/week to Z$750/week with
relatively large variations within provinces.
The reports
indicate that the payment rates in the cash for work programme are
not applied in a standardised manner.

Please credit www.kubatana.net if you make use of material from this website.
This work is licensed under a Creative Commons License unless stated otherwise.
TOP
|

