|
Back to Index
Election
Update - Comparison of registered voters 2000 & 2005 + Gender
analysis of candidates
Zimbabwe
Election Support Network (ZESN)
March 01, 2005
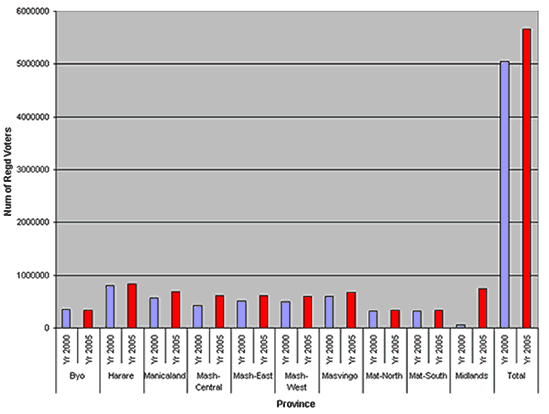
Comparison
of registered voters in year 2000 & 2005
|
2000 |
2005 |
BULAWAYO |
|
|
| Number
of Registered Voters |
357
281 |
339
990 |
| %
Total Registered Voters |
7% |
6% |
| Number
of Constituencies |
8 |
7 |
| HARARE |
|
|
| Number
of Registered Voters |
799
452 |
832
571 |
| %
Total Registered Voters |
15.83% |
14.71% |
| Number
of Constituencies |
19 |
18 |
| MANICALAND |
|
|
| Number
of Registered Voters |
576
404 |
686
767 |
| %
Total Registered Voters |
11.41% |
12.13% |
| Number
of Constituencies |
14 |
15 |
| MASH
CENTRAL |
|
|
| Number
of Registered Voters |
418
277 |
490
181 |
| %
Total Registered Voters |
8.28% |
8.66% |
| Number
of Constituencies |
10 |
10 |
| MASH
EAST |
|
|
| Number
of Registered Voters |
506
817 |
610
715 |
| %
Total Registered Voters |
10.03% |
10.79% |
| Number
of Constituencies |
12 |
13 |
| MASH
WEST |
|
|
| Number
of Registered Voters |
502
964 |
593
354 |
| %
Total Registered Voters |
9.96% |
10.48% |
| Number
of Constituencies |
12 |
13 |
| MASVINGO |
|
|
| Number
of Registered Voters |
593
778 |
675
234 |
| %
Total Registered Voters |
11.76% |
11.93% |
| Number
of Constituencies |
14 |
14 |
| MAT
NORTH |
|
|
| Number
of Registered Voters |
317
405 |
342
745 |
| %
Total Registered Voters |
6.29% |
6.06% |
| Number
of Constituencies |
7 |
7 |
| MAT
SOUTH |
|
|
| Number
of Registered Voters |
319
015 |
341
258 |
| %
Total Registered Voters |
6.33% |
6.03% |
| Number
of Constituencies |
8 |
7 |
| MIDLANDS |
|
|
| Number
of Registered Voters |
58
422 |
745
822 |
| %
Total Registered Voters |
13.52% |
13.18% |
| Number
of Constituencies |
16 |
16 |
| TOTALS |
|
|
Number
of Registered Voters |
5
049 815 |
5
658 637 |
% Total
Registered Voters |
100.41% |
99.97% |
Number
of Constituencies |
120 |
120 |
Number
of Registered voters

Gender
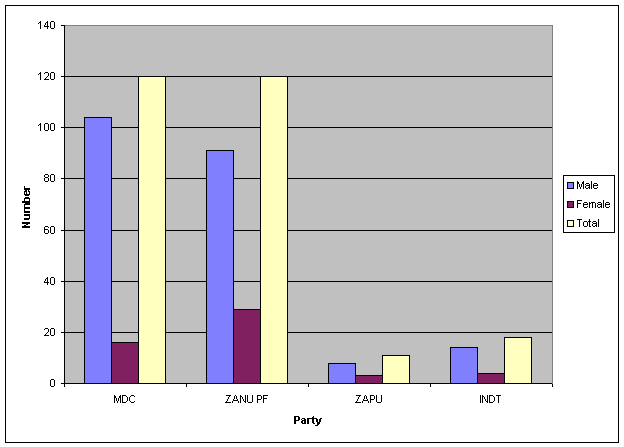
analysis per party
The graphical
illustration below clearly shows how the representation of women
in terms of candidature in the forthcoming election. As shown above,
ZANU PF has the greatest number of women candidates and this might
be attributed to the party's will to comply by the SADC Protocol
on Gender Equality and representation in Parliament to which Zimbabwe
is a signatory. The protocol states that by 2005 every SADC state
should be having at least 30% women representation in power. In
this instance ZANU PF is fielding more candidates for the coming
election as compared to the MDC. This is a very welcome position
that has been taken but the main opposition party still needs to
do more on meeting the gender representation requirements.

Visit the ZESN
fact sheet
Please credit www.kubatana.net if you make use of material from this website.
This work is licensed under a Creative Commons License unless stated otherwise.
TOP
|

